

The Bitcoin (BTC) price crash below $73,000 has brought renewed attention to key cycle indicators, with one metric now pointing to possible further downside. CryptoCon, a market analyst, says a shift in the Bitcoin Golden Ratio Multiplier is currently flashing bearish signals. He noted that the indicator has historically aligned with major price bottoms in past Bitcoin cycles. Based on that pattern, the current reading is now being interpreted as a warning that BTC could still face a deeper correction of up to 50% if the historical structure repeats.
Bitcoin Golden Ratio Multiplier Signals 50% Price Crash
In a recent post on X, CryptoCon warned that the market may still have more downside ahead, as key chart signals continue to point toward a deeper cycle bottom for Bitcoin. His analysis is based on the Golden Ratio Multiplier, a model used to identify major price peaks, bottoms, and extended market conditions.
He noted that Bitcoin’s cycle bottom estimate has steadily declined as the bear market progresses. According to him, the latest readings now place the expected bottom around $36,000, which would represent roughly a 51% drop from current levels above $73,000. He added that this shift shows the model is still adjusting as market conditions evolve.

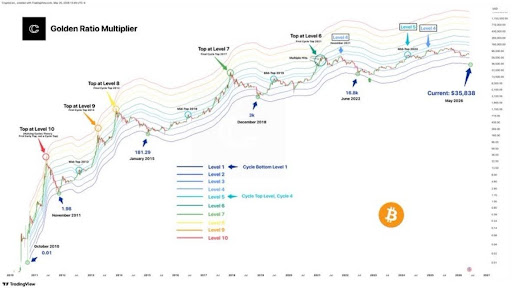
Sharing his chart, CryptoCon pointed to Level 1 of the model, currently aligned near $36,000. He stressed that this level has historically marked key cycle lows, including Bitcoin’s drop to $1.98 in November 2011, $181 in January 2015, $3,000 in December 2018, and $16,800 in June during the 2022 bear market.
Because of this surprisingly accurate track record, Crypto Con continues to treat Bitcoin’s Golden Ratio Multiplier as one of the most reliable tools for mapping Bitcoin’s long-term cycle structure and bottom target. However, he acknowledged that while the metric is reliable, the Level 1 price can change over time as market conditions change. This means that Bitcoin’s target could still drift lower than $36,000 if weakness continues, further adjusting the projected cycle bottom.
BTC’s Realized Market Cap Bottom Defines Range
In his analysis, CryptoCon also compared the Golden Ratio Level 1 with Bitcoin’s Realized Market Cap bottom, which currently sits near $42,500. The Realized Market Cap bottom tracks the average price at which all BTC tokens were last moved on-chain and has historically aligned with major capitulation phases and bear market lows when the price approaches it.
With the Golden Ratio Multiplier Level 1 at roughly $36,000 and the Realized Market Cap floor at $42,500, CryptoCon predicts that BTC’s likely cycle bottom will fall somewhere between the two targets. From current market prices above $73,000, a move into this bottom range would imply a decline of roughly 42% to 52%, depending on where BTC’s price ultimately settles.
